In the latest officially verified Income Tax Return (ITR) data for India, Maharashtra stands far ahead with 1,24,800 individuals reporting annual income above ₹1 crore — more than five times the number in southern states like Karnataka and Tamil Nadu. Uttar Pradesh, surprisingly for many analysts, outpaces both southern powerhouses in the crorepati count with 24,050 high-income filers, despite lower urban affluence relative to Karnataka or Tamil Nadu. This signals shifting regional economic dynamics beyond conventional GDP and investment narratives.
Who’s Leading India’s Crorepati Count?
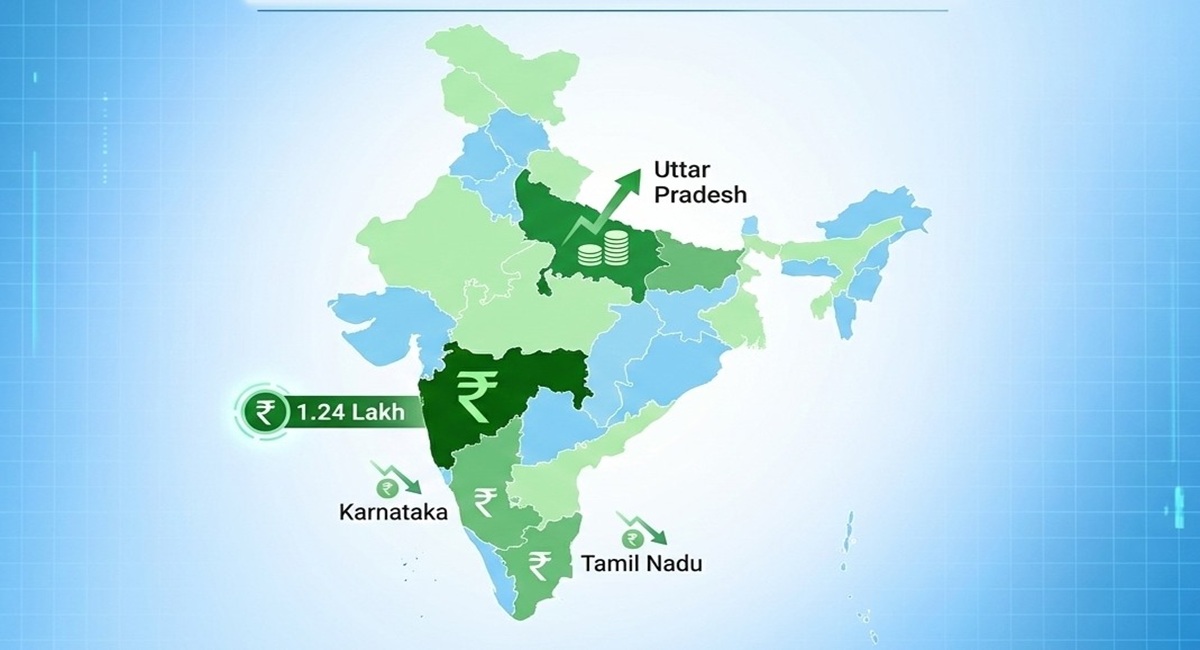
Maharashtra is the undisputed leader with 1.24 lakh+ individuals filing returns showing income above ₹1 crore, followed by Uttar Pradesh (~24,050). In contrast, Karnataka (~2,816) and Tamil Nadu (~6,288) report far fewer such high-income filers — an outcome that upends expectations tied to tech-led prosperity in Bengaluru and Chennai.
1. What the Latest Data Shows
According to the most recent official break-down of individual tax returns declaring income over ₹1 crore:
| State | Number of Crorepati Tax Filers |
|---|---|
| Maharashtra | 1,24,800 |
| Uttar Pradesh | 24,050 |
| Delhi | ~20,500 |
| Madhya Pradesh | ~8,666 |
| Tamil Nadu | ~6,288 |
| Karnataka | ~2,816 |
| Gujarat | ~3,540 |
| Others | (smaller states/UTs) |
These figures reflect assessment year 2023-24 (income earned in FY23) and are drawn from verified tax e-filing breakdowns released by authorities and corroborated via multiple state-wise data aggregators.
2. Maharashtra’s Crorepati Dominance
There’s a reason seasoned economists like to say Mumbai is not just a financial capital — it is India’s wealth engine.
- Maharashtra’s 1.24 lakh crorepati filers account for well over half of India’s total high-income group — an extraordinary concentration of wealth.
- This aligns with the state’s massive economic footprint: Maharashtra leads India in nominal GDP (~₹42.7 lakh crore), making up ~13% of national output — ahead of states like Tamil Nadu and Karnataka.
- Mumbai’s role as the country’s capital of finance, corporate headquarters, and entertainment industry helps explain why so many high-net-worth individuals (HNWIs) report taxable income there.
Simply put: Maharashtra’s economy isn’t just big — it creates and attracts wealth that gets captured in formal tax filings, which isn’t always the case elsewhere.
3. Uttar Pradesh’s Surprising Surge
For decades, policymakers and business analysts have looked at Uttar Pradesh through the lens of demographic potential rather than high-income achievement. But the tax data tells a nuanced story:
- With 24,050 individuals reporting annual income above ₹1 crore, Uttar Pradesh is second only to Maharashtra among Indian states in crorepati filings.
- This reflects two intersecting realities:
- UP’s massive population pool (India’s most populous state) naturally generates a larger absolute number of high earners even if proportions are lower.
- Rapid urbanisation across cities like Noida, Ghaziabad, Lucknow, and Kanpur fuels professional, corporate, and entrepreneurial income that increasingly enters the formal tax system.
This trend highlights how sheer population scale — when combined with structural economic growth — can shift wealth patterns.
4. Southern States: Karnataka & Tamil Nadu
On paper, states like Karnataka and Tamil Nadu — with world-class tech ecosystems and manufacturing bases — should show strong high-income tax filing. Yet the numbers tell a different story:
- Karnataka: ~2,816 crorepati tax filers — significantly lower than UP despite Bengaluru’s booming IT and startup sectors.
- Tamil Nadu: ~6,288 filers — respectable but far below Maharashtra’s figure.
This isn’t a reflection of wealth absence. Rather, it points to structural differences in income reporting, corporate salary structures, and tax compliance incentives.
For instance:
- Much of Karnataka’s high tech income may be generated by companies whose retained earnings aren’t directly reflected as high individual earnings.
- Tamil Nadu’s industrial base disperses earnings more broadly rather than concentrating them in personal income tax brackets.
These dynamics mean GDP and corporate profitability don’t automatically translate into crorepati counts on the tax rolls — especially if individuals have tax planning structures or defer income recognition.
5. Why Numbers Don’t Always Match GDP or Tech Output
A headline like “Karnataka has lower crorepatis than Uttar Pradesh” can shock — but it makes sense once you look under the hood:
- GDP vs. Personal Income: A state’s GDP can be high without proportionately many individuals reporting high salaried income, because profits are often retained by corporations or reinvested rather than passed into personal income.
- Tax Compliance Patterns: High net worth individuals may use trusts, family offices, or corporate structures that defer personal tax implications — reducing their visibility in simple ITR counts.
- Sectoral Income Differences: Professional service sectors (law, finance, entertainment) dominate high personal incomes more than manufacturing or IT exports, where compensation models vary widely.
So, economic output alone doesn’t equate to crorepati numbers. Maharashtra’s unique mix of finance, entertainment, and large business ownership amplifies taxable personal income reporting more than mere output statistics would suggest.
6. Drivers Behind Rising High-Income Tax Filers
Why are crorepati filings increasing nationwide?
Experts point to several verified factors:
- Wider tax base and compliance due to digital e-filing ease and stricter enforcement.
- Rapid expansion in professional services, private sector wages, and entrepreneurial success.
- Rising entrepreneurial ecosystems creating high-income brackets in non-traditional sectors.
- Greater transparency and reporting as financial data becomes interconnected across banking, securities, and property databases.
Nationally, over 3.21 lakh individuals filed individual ITRs with income over ₹1 crore in FY25, compared to lower historical figures — a jump of over 40% year-on-year.
7. Implications for Policy & Wealth Distribution
The state-wise crorepati distribution — heavily skewed toward Maharashtra and followed by UP — has several policy implications:
- Tax administration efforts should focus on incentivising high-income reporting in lagging regions.
- Economic development strategies might leverage UP’s unexpected surge by fostering infrastructure for high-skill sectors.
- Southern states may need to better align tax reporting practices with the economic value created in sectors like tech and manufacturing — without dampening innovation.
Understanding who earns and who pays taxes is critical for equitable fiscal policy, public service funding, and tax reform debates.
Conclusion & Forward-Looking Editorial Perspective
From Maharashtra’s dominance to Uttar Pradesh’s rise and the comparatively modest crorepati representation in Karnataka and Tamil Nadu, the latest ITR data paints a complex and evolving picture of India’s wealth geography. This isn’t a simple north-south or urban-rural divide — it’s a mosaic shaped by population scale, economic structure, tax compliance, and income reporting practices.
For policymakers and economic strategists, this means:
✔ Maharashtra remains the benchmark for formal wealth reporting.
✔ Uttar Pradesh can’t be ignored in high-income discourse despite traditional perceptions.
✔ Southern states with high GDP must reconcile output with personal income visibility.
In the end, the growth in Indian millionaires and crorepatis is real, measurable, and accelerating — even as the underlying story reveals deeper socioeconomic currents that numbers alone can’t explain.