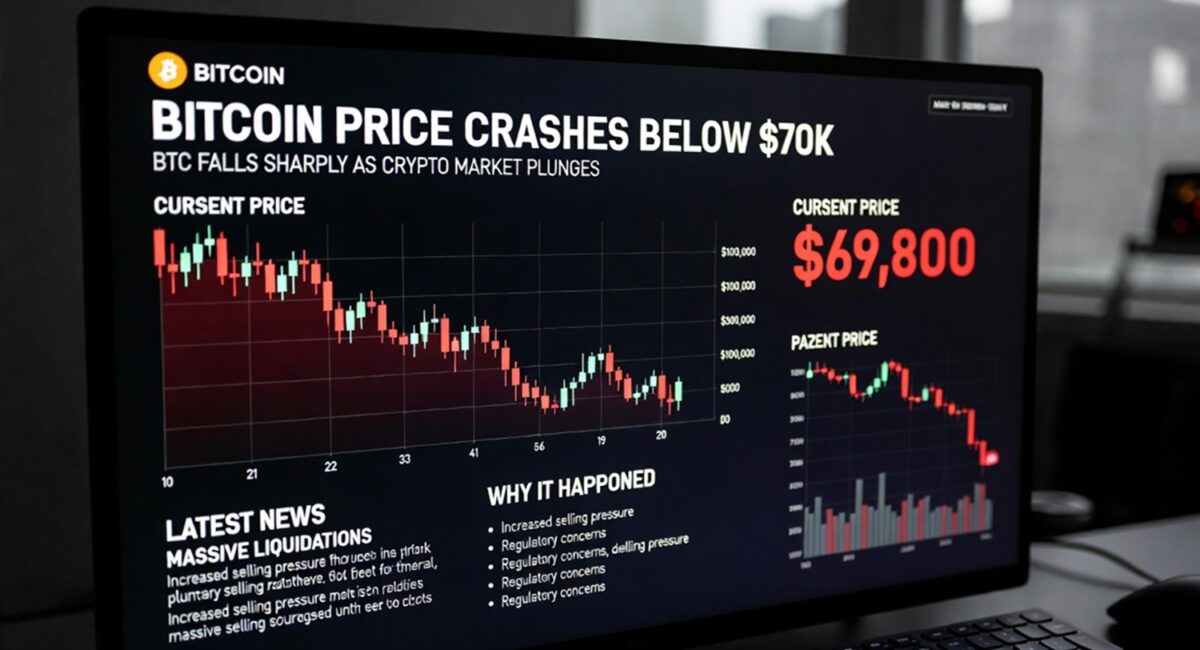
On February 5 2026, Bitcoin (BTC) crashed below the critical $70,000 threshold, marking its lowest sustained level in roughly 15 months as heavy liquidations, weak spot demand, and macro pressures combined to drive a broader crypto market downturn. This wasn’t a random drop — institutional outflows from Bitcoin products, forced futures liquidations, bearish sentiment, and correlations with risk-off moves in traditional markets all converged, pushing BTC into a deeper correction and amplifying fear among traders.
Why This Matters Now
When a major crypto asset like Bitcoin slips below a widely watched support level like $70K, two things happen almost immediately:
- Retail and institutional psychology shifts, often triggering further selling.
- Algorithmic and leveraged positions begin cascading liquidations, dragging prices down faster than the initial catalyst.
For investors and market watchers alike, February 5’s move signals a broader repricing of risk assets — and potentially the early stages of a deeper market adjustment.
BTC Price Breakdown: What Happened on February 5
Bitcoin Under Pressure: Price Levels and Recent Moves
- BTC traded below $71,000–$73,000, its weakest level since late 2024, after failing to hold key supports above $75,000.
- The price retraced sharply from recent highs around $76,000-$78,000, marking a continuation of a downtrend seen through late January and early February.
- Across the top 10 cryptocurrencies, nearly all major coins were in the red, underscoring the systemic nature of the sell-off.
Crypto market capitalization was also down materially, reflecting broad weakness.
Top Reasons Bitcoin Crashed Below $70K
1. Forced Liquidations Fueled a Cascade
A major driver on February 5 was forced liquidations of leveraged positions — especially long bets — which occur when prices fall past stop levels and exchanges automatically close positions. This injects more selling pressure into the market.
- Markets saw hundreds of millions — and in some reports billions — wiped out in liquidations over recent sessions.
- Derivatives exchanges like Binance, Bybit, and others posted large clusters of liquidated longs, exacerbating the crash.
This chain reaction of closing positions can turn a routine correction into a rapid drop, especially in markets with high leverage.
2. Weak Spot Demand and Negative Premiums
BTC’s decline wasn’t purely driven by futures markets. Spot demand — actual buying of the asset on exchanges — was weak, meaning fewer buyers were ready to absorb the selling.
- Negative Coinbase premiums (where BTC trades cheaper on Coinbase than on other global exchanges) indicated sluggish buying interest from U.S. traders, a key demographic.
Without strong spot demand, price drops can be deeper and sharper, regardless of technical levels.
3. Macroeconomic Headwinds
Bitcoin’s price action is increasingly tied to traditional risk assets:
- Higher interest rates and tightening monetary policy make speculative risk assets like crypto less attractive relative to cash or bonds.
- Broad risk-off moves in technology and growth stocks have correlated with BTC weakness.
When traders grow cautious about broader markets, Bitcoin — often seen as risk-on — tends to suffer.
4. Institutional Outflows Hit ETFs Hard
Bitcoin’s relatively recent correlation with institutional investment products like spot ETFs has been a support on the upside — but:
- Recent weeks saw notable outflows from Bitcoin ETFs, reducing a key source of buy pressure.
- With fewer institutional buyers, the market becomes more dependent on retail and leveraged trading, which can accelerate downside moves.
ETF outflows are particularly concerning because they signal larger investors are reallocating away from crypto, rather than only short-term traders.
5. Fear and Sentiment Shifts
Sentiment indicators like the Fear & Greed Index fell toward extreme fear levels, reflecting widespread nervousness among traders.
- Extreme fear conditions often coincide with capitulation — a period where holders sell positions out of panic rather than strategy.
When sentiment turns negative, even minor news or technical breaks can trigger outsized market reactions.
Technicals: Support Levels and Key Price Zones
From a technical perspective:
- $75,000–$78,000 had recently acted as resistance, and losing that zone opened the door to deeper declines.
- The $70,000 level is widely considered a psychological pivot — and breaking it confirmed bearish commitment.
- Below $70K, the next major technical floors are in the $64,000–$68,000 range according to various analysts.
Longer-term investors watching daily or weekly charts may interpret the break as a signal of a transition from short-term correction toward a broader market reset.
How Traders Are Reacting
Across social and trading communities:
- Many are debating whether this is a temporary pullback or the start of a deeper bear cycle.
- Some traders are considering dollar-cost averaging (DCA) or waiting for deeper support levels.
- Others are watching closely for key support holds or breakouts in the near future.
This mixed response reflects the uncertainty that accompanies sharp breaks of major technical levels.
What This Means in the Bigger Picture
Bitcoin’s crash isn’t isolated — it mirrors broader trends across risk assets. Several high-level takeaways:
- Risk-off market sentiment can trigger synchronized selling across stocks, crypto, and other speculative assets.
- Liquidations amplify downturns when price breaks technical support.
- Institutional and retail flows both matter — weak touches on either can accelerate moves.
For those with experience covering multiple Bitcoin cycles, this pattern — where macro, sentiment, and leverage collide — often precedes periods of consolidation, not just brief corrections.
Looking Forward: What To Watch Next
Here are key indicators traders and analysts are monitoring:
1. Does Bitcoin Hold the $70,000 Zone?
If BTC reclaims this level and holds, it may stabilize. If not, lower support ranges come into focus.
2. ETF Flow Trends
Flows into or out of Bitcoin ETFs will be critical — continued outflows could signal deeper institutional retreat.
3. Macro Signals
Central bank guidance, inflation data, and equity market moves will all influence crypto risk appetite.
Conclusion: Crash, Correction, or Capitulation?
The Bitcoin price crash on February 5, 2026 was not a random blip. It came from a confluence of forced liquidations, macro headwinds, weak demand, and waning institutional support — the perfect storm that pushed BTC below $70K.
From my years tracking digital assets through multiple cycles, this kind of breakdown often represents market psychology shifting from optimism to caution. It doesn’t necessarily mean the bull market is over, but it does mean traders and investors are re-evaluating risk — and that Bitcoin’s next directional moves will be shaped as much by macro conditions as by crypto-specific factors.
Whether this proves a brief capitulation or the start of a deeper bear cycle will depend on how the market digests these pressures in the coming weeks and months.